This TrendSpider review will highlight the best tools TrendSpider has to offer demanding Traders. A review of the TrendSpider Market Scanner, Multi-Timeframe Analysis, and Dynamic Price Alerts are also covered with screenshots.
TrendSpider Review Quick Summary
TrendSpider has the best Technical stock screener, and the many options available on their alerts system make this the best platform for active Traders that I have reviewed so far. Visit Website for more info.
Use Coupon Code SST15 to get a 15% discount.
TrendSpider Charts Review
All of the following screenshots can be enlarged by clicking on them.
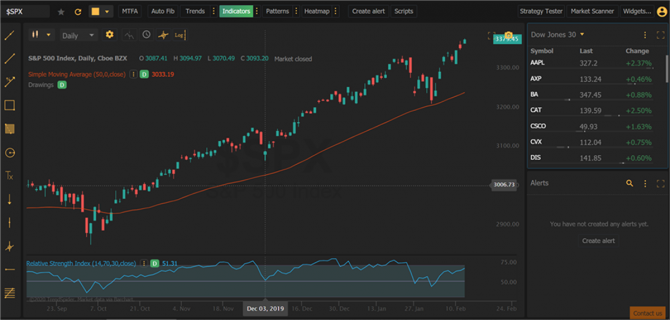
TrendSpider charts come with a dark theme, light theme, and a blue theme called the ‘Good Ol’ Days’. The sad thing is I’m old enough to remember that style… brings back memories of old chunky computers.
But we all have to adapt with the changing times and keep learning. All of the following screenshots will use the light theme which I prefer.
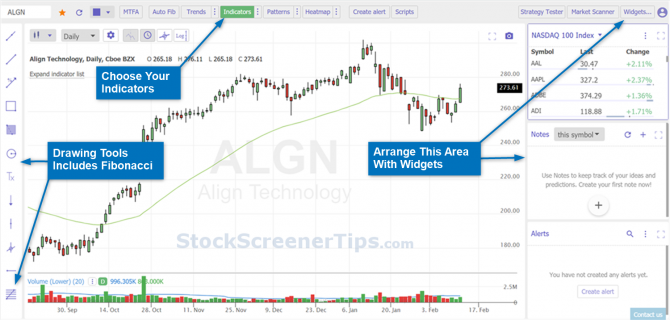
The charts are sharp and the layout is practical and easy to navigate. The right side pane can be managed with widgets for Watchlists, Scanners, Alerts, and Notes; a very useful addition.
Indicators are easily added and amended, with currently 96 indicators to choose from.

There are more than enough indicators to satisfy even the most demanding trader.

Once you have selected your indicators, you can actually enable and disable them so they don’t clutter up your charts. This is a nice thoughtful design touch. The complete indicator list can also be hidden.
Multiple Chart Selection

You can show up to 4 charts for one symbol.
I use multi-timeframes for my analysis. I use Daily and Weekly charts for Position trading, and 1-hour and Daily charts for my Swing trading. I consider Multi-timeframe trading as one of the trading edges I have in the markets. More on multi-timeframe setups later.
TrendSpider Automated Trendline Detection
TrendSpider makes life easier for Traders by automating many aspects. Let’s start with trendlines.
Trendlines are a powerful tool in Technical Analysis, used long before Moving Averages were invented. They can be considered a Leading Indicator as they can be projected into the future, unlike moving averages which are a lagging indicator.
The problem is not everyone draws them the same way, so many people consider them subjective. But what if you let an Algorithm draw them using the same consistent rules every time, and drawn automatically for you. Now they become powerful, and easy to use.
I have to admit I hated drawing trendlines manually. I even convinced myself that with 20 years of trading experience I can see the important trendlines mentally. If you’re following 200 stocks, who has time for drawing manual trendlines when you can use moving averages, right?
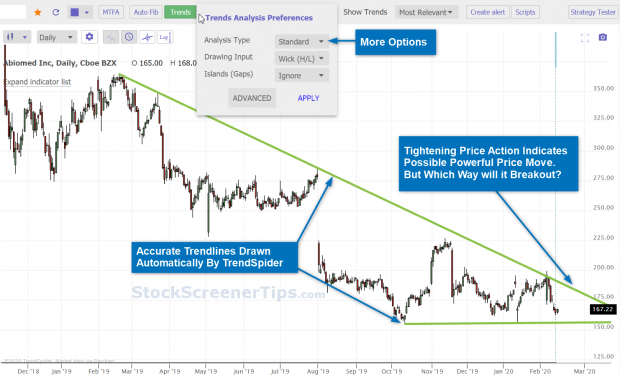
TrendSpider has changed that for busy traders with automated trendlines. See the chart above and the formation of a triangle pattern. Without the trendlines I wouldn’t have seen that price action tightening.
You can show more trendlines by changing the ‘Show Trends’ setting, but I prefer the ‘most relevant’ setting.
TrendSpider Automated Heatmap
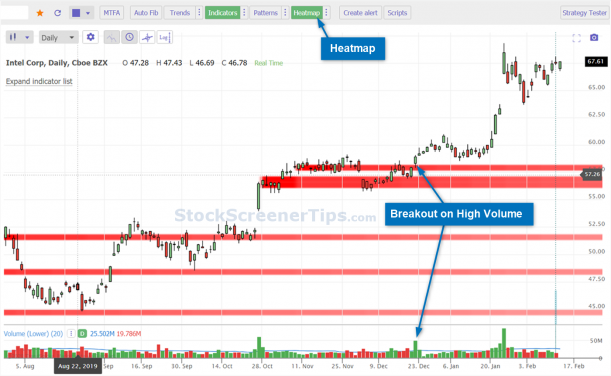
Just like the trendlines, Trendspider also has automated heatmaps, which highlight strong support and resistance areas. In the example above, you can see Intel breaking out on high volume, after finding support at a level highlighted by the heatmap.
We can even combine TrendSpider’s automated trendlines and heatmaps for even more powerful analysis.

You can tell there are real Traders behind the design of TrendSpider and not just programmers.
Other automated tools include automated Fibonacci retracements drawn for you. Extremely useful for Forex, Futures, and Crypto Traders.
Candlestick Pattern Recognition Software
Yes, the TrendSpider software can also find candlestick patterns on a chart for you, accurately.
I have come across many charting software that claim to have pattern recognition, but fail miserably or are mediocre at best.
I wasn’t really expecting much this time around either, but was blown away at how good TrendSpider was at finding these candlestick patterns.
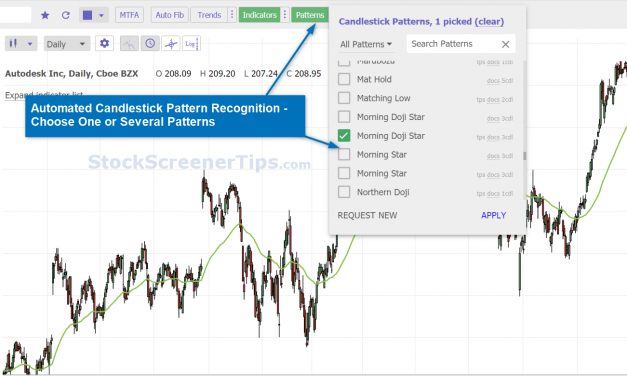
You can choose one or several candlestick patterns. Most people pick the Hammer or Doji candlestick patterns, which are an excellent choice to start with.
But I also like candlestick patterns consisting of 3 candles. Here, I have chosen the ‘Morning Doji Star’ pattern. This pattern can be found at reversals and bounces at support levels.

You can also include candlestick patterns along with indicators, when you perform market scans. More on this later, in the Market Scanner section.
TrendSpider Multi-Timeframe Analysis
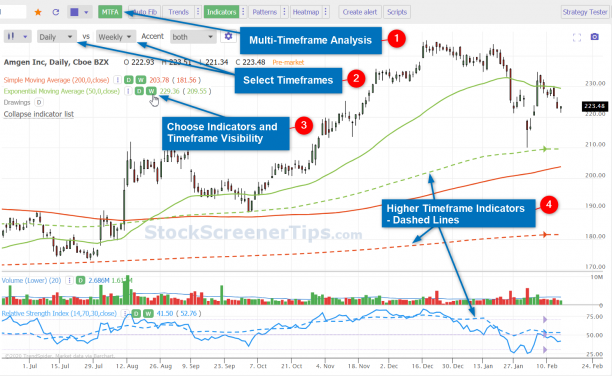
The Multi-Timeframe Analysis function is really exciting to see in a charting package.
I have previously mentioned that Multi-timeframe trading is one of the trading edges I have in the markets. Sometimes I use two charts side by side, and have lower indicators with settings for two timeframes. This works OK but can clutter up a chart.
But TrendSpider’s MTFA function again makes life easier for the Trader. You can have all the information of 2 timeframes on one chart. This really makes my life easier, and helps me make better trading decisions, and avoid many mediocre or losing trades.
Regardless of your style of trading, day trader or long-term investor, this is a must use function. Even if you use the one chart setup as shown in the screenshot above.
Pay attention to the interaction between the two timeframe indicators in the lower window, and to confluences of the indicators in the top window.
TrendSpider Scanner
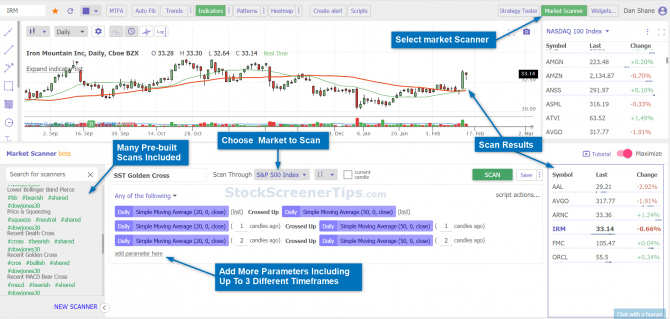
This is what it’s all about; traders always need to find opportunities, otherwise you don’t make any money. Market Scanners and screeners are the goose that lays the golden eggs.
What makes the TrendSpider Market Scanner stand out is that you can scan for criteria on 3 different timeframes at the same time. Talk about fine tuning a scan. TrendSpider truly is made by Traders for Traders.
Scans can also include candlestick patterns, volume, and a host of technical indicators.
I spoke to the CEO of TrendSpider, Dan Ushman, and he confirms they will be adding Fundamental data sometime this year.
Market scanners and screeners (along with alerts) are crucial tools for any Trader or Investor to make money from the markets.
It would be an injustice to try to cover all the features of the TrendSpider Market Scanner in this review. I will instead be writing several articles about the scanner with complete scans you can use, in the near future. So please add this site to your favorites and make sure to return.
TrendSpider Alerts Review
Have you ever followed a stock, waiting for a pullback or breakout, then taken your eye off the ball, only to see the stock has taken off without you. Believe me I know the feeling; I have had too many of those missed trades.
Because of the many missed opportunities, I regard alerts equally as important as screeners.
I always say to people that scanners and screeners are just the first part of the process. Not all scan results can be immediately traded. Sometimes you need to add a further alert to meet your conditions to obtain a low risk, high probability trade.
Also alerts can be used to exit a trade at optimum price points. Using the scan result from above, let’s add some alerts to the Iron Mountain (IRM) stock chart. These alerts will be used to help us exit the trade.
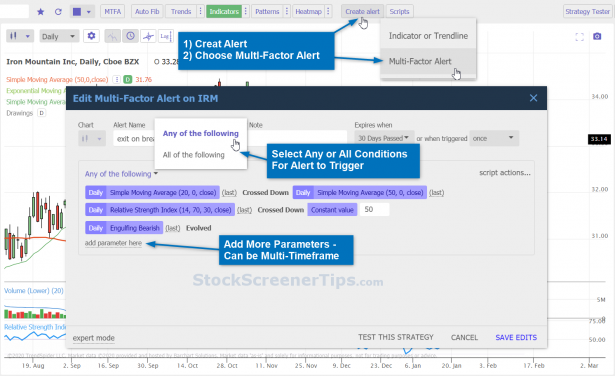
In the screenshot above, ANY of the conditions met will trigger the alert. We can then choose whether to exit the trade, or amend the alert.
Alerts can also be set where ALL conditions must be met before the alert is triggered. This can save us time and being overwhelmed by receiving too many alerts.
The TrendSpider alerts are not your average price alerts you find in some platforms. In fact many of the options are closer to scan conditions. In the example above I have also used a candlestick pattern as an alert trigger. You can also add multi-timeframe parameters (including intraday). The alert above is known as a ‘Multi-Factor Alert’.
You can also easily create alerts on trendlines, indicators, and Fibonacci levels with a simple right click. These alerts are known as Dynamic Price Alerts.

In the example above I have combined a breakout and bounce alert at the trendline, so I can take a trade in either direction.
Note the ‘Sensitivity’ option. You don’t want to miss out on an alert because it didn’t touch the exact price level. Allow some leeway in price targets, in either direction.
Here is another example for Forex Traders.
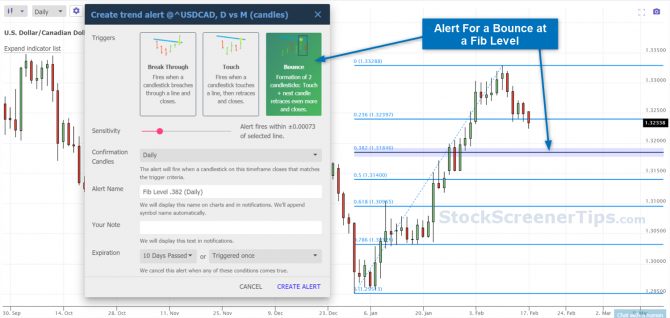
Many Forex Traders get in too early when trading a bounce at a Fib Level, and watch as price continues lower. Wait for the bounce; better still set an alert for the bounce so you are not tempted to get in early and be wrong.
Alerts can be a screen pop-up or sent via email or SMS to your phone.
With the variety of alerts in TrendSpider, It feels like I have a Personal Assistant working for me.
“They say money never sleeps; neither do TrendSpider Alerts.”
TrendSpider Backtesting Review
If all the above tools weren’t enough to help traders, TrendSpider also has a backtesting option called Strategy Tester. So it’s more than just backtesting, you can create and test your own trading strategies.
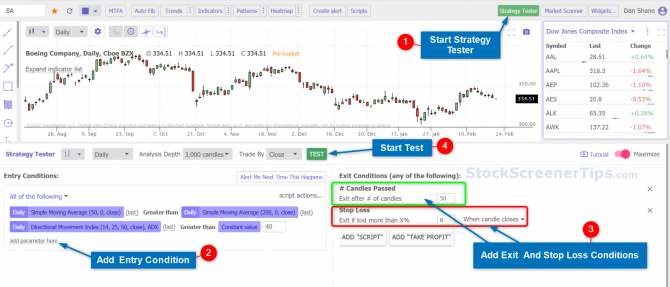
The Strategy Tester is simple to use with no programming skills required. Follow the steps in the above screenshot to create and test a strategy. For exit conditions you can also use indicators by using the ‘ADD “SCRIPT” option.
Click the TEST button to run a back-test of the strategy on the selected instrument.

Note: the above is just an example strategy to highlight how to use the Strategy Tester. DO NOT use it for your trading without further testing.
Here are the results of a real strategy that I am testing for myself. I have not shown the conditions as it is still work in progress.

This looks interesting with 87% winners and average return of 20%, and out-performs buy and hold by 290%. This was back-tested on 12 years of data for this instrument. Definitely worth further investigation.
Currently the TrendSpider Strategy Tester can only back-test on one instrument or market at a time. But that is enough to know if a strategy is worth spending more time testing.
There is not enough space in this review to do it justice, so I will be writing a separate article about it. But for now just be aware it is available.
TrendSpider also has other tools like their unique Raindrop charts, which again, really require a separate article. So stay tuned for that.
TrendSpider App
The TrendSpider App was released in July 2021 due to strong demand by users.
The TrendSpider mobile app is available on iPhone and Android devices. The app is a companion to the main TrendSpider platform, and is designed to work seamlessly with the web-based version of TrendSpider.
Now you have the freedom to monitor your charts, watchlists and alerts on the go.
TrendSpider Pricing
There are 4 price plans available for TrendSpider. Please take the time to check the Comparison Table on the site to see you are getting the tools you require.
For example, Multi-Timeframe Alerts are only available on the Elite and Master Plan. There is real-time data for stocks, forex, and Crypto. Data for indices and futures is currently delayed.
As TrendSpider prices can change please see TrendSpider price plans for the latest pricing.
TrendSpider Coupon Code
You can use the TrendSpider Coupon Code SST15 to get a 15% discount for 12 months.
Summary
I hope this TrendSpider review has shown you that this really is a great charting platform for traders. With an excellent multi-timeframe market scanner and alerts system, no active trader can afford to be without it.

I now rely on TrendSpider for all of my technical scans. When they add fundamental data, I will probably use it exclusively.
The abundance of trading opportunities I am finding with TrendSpider is truly remarkable. I have to actually throw many of the fishes back!
I have been surprised at how many of the tools reflect the way I trade, such as the ‘Multi-Timeframe Charts setup, to the ‘Break Through’ and ‘Bounce’ alerts.
It shouldn’t really be a surprise, as TrendSpider is designed by people who actually trade. Their passion for trading and developing TrendSpider has been evident whenever I have spoken to the team, In particular their CEO, Dan Ushman. I know there will be more functionality coming soon.
For me, I’m hooked and am going along for the ride with the TrendSpider team; with excited anticipation for their next innovation that makes my trading life easier…and richer.
| TrendSpider Review Rating | |
|---|---|
| 🏆 Features | ★★★★★ |
| 📊 Screener | ★★★★★ |
| 📈 Charts | ★★★★★ |
| ✔️ Ease of Use | ★★★★★ |
| 📧 Customer Service | ★★★★★ |
| ⭐ Rating | ★★★★★ 5/5 |
| 💰 Discount | 15% Off with Coupon Code: SST15 |
I hope you found this TrendSpider review useful. Give it a try, you’ll be glad you did.
Visit TrendSpider for more info.
Don’t forget to use the Promo Code SST15 to get 15% off the first month or first year of your subscription.


