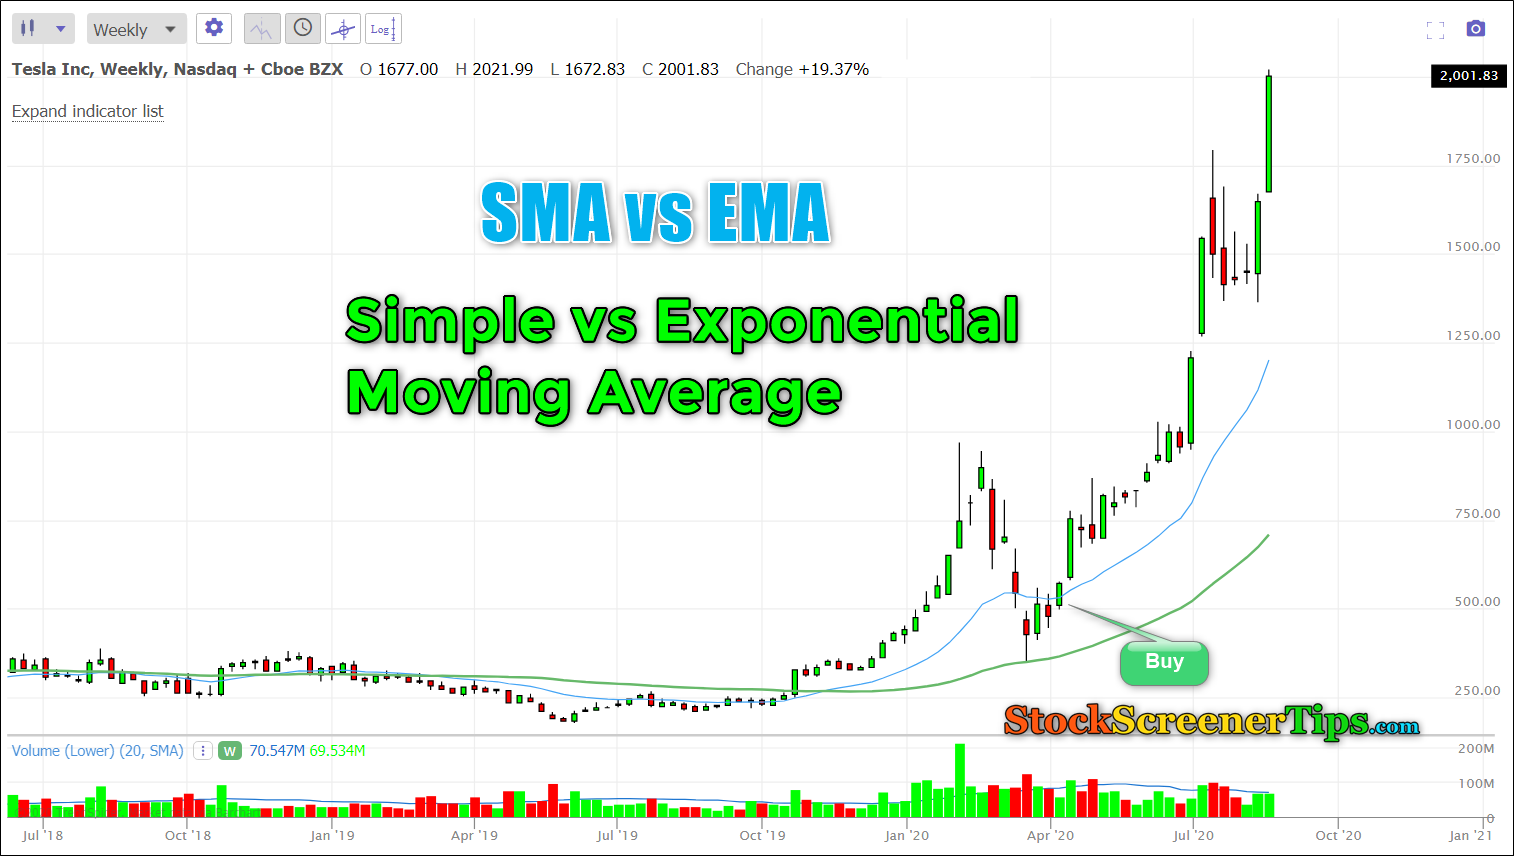
Moving averages are a must have for any trader. When choosing between simple moving averages (SMA) and exponential moving averages (EMA) you need to know the differences and applications.
Taking the time to research the different types of moving averages will help you with your trading strategy. SMAs and EMAs have their own advantages and knowing when to use each will give you insight into the market trend and entry or exit points. Knowing the differences will help you choose the right moving average for you.
Moving averages are a basic technical indicator in trading, to help you see trends and make better decisions. Two of the most common are simple moving averages (SMA) and exponential moving averages (EMA). They smooth out price action over a certain period of time so you can see the bigger picture.
While both SMA and EMA do the same job, they calculate and react to price changes differently. SMAs give equal weight to all data points, a straight average of prices over time. EMAs put more emphasis on recent prices, so they are more sensitive to current market conditions. Knowing the difference will help you choose the right moving average for your strategy and time frame.
Moving Average Explained
How to Calculate SMA
The Simple Moving Average (SMA) is a simple to follow trend. You calculate it by adding up the closing prices over a certain period and dividing by the number of periods. For example to calculate a 10 day SMA, add up the last 10 closing prices and divide by 10.
SMAs give equal weight to all data points, so they are less responsive to recent price action. Good for long term trends but will lag behind fast market moves.
Traders use SMAs to:
- Follow trend direction
- Find support and resistance levels
- Get buy or sell signals when price crosses the average
Remember SMAs are best in trending markets and will give false signals in sideways price action. You can adjust the period to suit your trading style – shorter for more sensitivity, longer for smoother trends.
Exponential Moving Average (EMA)
The Exponential Moving Average (EMA) is a powerful indicator that gives more weight to recent price data. This allows traders to see trends faster and react quicker to market changes. Unlike the SMA, the EMA reduces lag by giving more importance to newer data, so perfect for short term trading strategies.
EMAs are known for their reactivity to price action. They can help you see trend reversals or confirmations earlier than other indicators. But this reactivity comes with a cost. The EMA’s quick reactions will sometimes give false signals especially during high volatility.
How to Calculate EMA
To calculate an EMA you will need a few steps and some initial data. You will need the Simple Moving Average (SMA) as a starting point and a multiplier to increase the weighting of newer prices.
- Calculate the multiplier using this formula: Multiplier = 2 / (number of periods + 1)
- For a 10 period EMA, the multiplier would be: 2 / (10 + 1) = 0.1818 or 18.18%
- The EMA formula is: EMA = (Current price x Multiplier) + (Previous EMA x [1 – Multiplier])
You will need to apply this formula recursively using the previous period’s EMA in each calculation. For the first calculation you can use the SMA as the previous EMA.
While understanding these calculations can be helpful, most trading platforms have built-in EMA indicators. You can add EMAs to your charts by selecting the option from the indicators list in your trading software.
Simple vs Exponential Moving Averages
Moving averages are a trader’s best tool to follow price trends and make decisions. Simple moving averages (SMAs) and exponential moving averages (EMAs) are the most popular ones.
SMAs add up the price over a certain period and give equal weight to all data points. They are slower to react to price action and good for long term trends and support or resistance levels. Traders use SMAs to confirm trends rather than predict them.
EMAs on the other hand give more importance to recent price data. This increased reactivity to current market conditions makes EMAs react faster to price action. Short term traders prefer EMAs for their ability to catch fast market movements and get early signals.
When choosing between SMAs and EMAs consider your time frame and goals. SMAs are good for longer term trades and trend confirmation, EMAs are good for short term trading and quick price action.
SMA and EMA Examples
You can combine SMAs and EMAs to create trading strategies. One popular one is the moving average crossover, which uses a longer SMA to define the trend and a shorter EMA as a signal line for entries.
For example you might use a 50 period SMA to define the bigger trend and a 20 period EMA to see trend changes. When the EMA crosses above the SMA it may be a bullish signal. When the EMA crosses below the SMA it may be a bearish signal.
Here’s how to trade these signals:
- EMA crosses below SMA: Sell
- Price touches SMA from below: Resistance, wait for trend to continue
- Price breaks above SMA: Trend reversal, get ready to buy
- EMA crosses above SMA: Buy or close short
Remember moving average crossovers can give false signals in choppy or sideways markets. To minimize this risk:
- Use other indicators to confirm signals
- Wait for price to close beyond the crossover
- Look for other price action patterns
By combining SMAs and EMAs you can see the market better and make better decisions. Try different time periods and combinations to see what works for you and your risk level.
Summary
Moving averages are trader’s tools. Simple moving averages (SMAs) are good for long term trend, gives a steady view of the market direction. Exponential moving averages (EMAs) are good for short term, gives quicker response to price action.
You can improve your strategy by combining these indicators with others like RSI or MACD. SMAs defines the bigger trend, EMAs can spot entry and exit points. Remember to match the moving average to your time frame for best results.