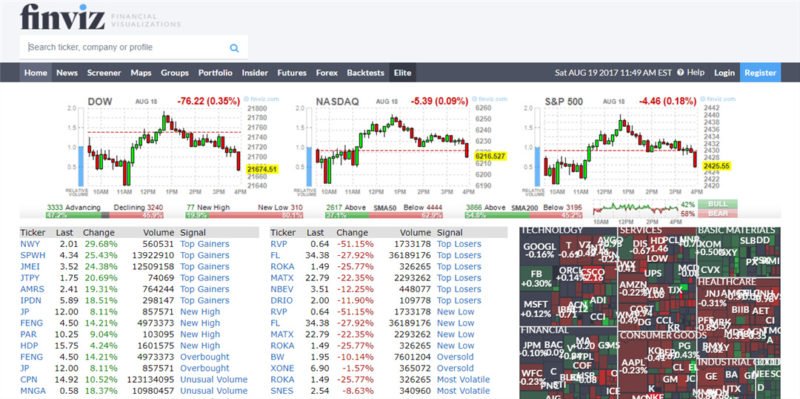
Finviz Elite stock screener review: This review shows how Finviz Elite makes finding stocks to trade quick and easy. This stock screener allows export of data to excel which many of you will find useful. Parts of the site only available to Finviz Elite members are reviewed with screenshots. Including Finviz Elite custom options, alerts and backtesting.

Many traders in the past had to rely on just technical analysis or fundamentals for their stock scans. However, many stock screeners are now combining both, and Finviz Elite does a great job of this.
Whether you are a trader or an investor, value or growth orientated, Finviz can help you find the stocks that meet your criteria. I even know of many day traders that use the screener every day to find the big movers of the day.
Finviz Elite Stock Screener Review
All of the following screenshots can be enlarged by clicking on them.

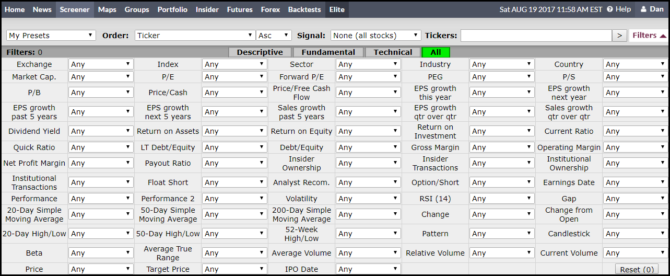
On the Screener Page, the ‘ALL’ tab shows all the combined options available from the ‘Descriptive’, ‘Fundamental’, and ‘Technical’ tabs.
This can seem a bit overwhelming, so let’s break it down to a single tab.

Selecting one tab at a time, and choosing your screening criteria on each tab, shows how simple the finviz screener really is. There is absolutely no need for programming or scripting skills.
The ‘Descriptive’ Tab is a good place to start. Just by defining a few elements such as ‘Market Cap’, ‘Volume’, ‘Price’, can greatly reduce the number of stocks.
Another option could be looking at out-performing or even under-performing sectors.
Finviz Screener Sector & Industry Selection

Selecting a sector, will show the Industry groups that belong to that sector. The free version only allows the option of choosing one industry group at a time. With the elite version, you can select multiple industry groups by clicking on the custom option. This makes life easier.
Selecting the ‘custom’ option, shows the pop-up box below appears.

By selecting a range of industry groups that are of interest, saves a great deal of time in the screening process.
There are many more ‘Custom‘ options available in Finviz elite that help save a huge amount of time, and more importantly; make stock screening more precise.
For example, a simple task such as selecting a price range (not available on the free version), makes life easier when performing scans on a daily basis.

The free version (above) only gives broad price options such as under $50. This can result in hundreds of stocks to sift through. Time and patience many of us just don’t have.

With Finviz elite, a price range can be specified, resulting in not only a smaller list of stocks, but in a price range we are actually interested in.
The above two ‘Custom’ examples are just a few available in Finviz elite, to not only make life easier by saving time, but to get the precise lists of stocks & ETFs we are screening for.
Finviz Elite Stock Screener Results
The screen results can be shown in many formats, from lists to charts. I prefer the charts layout below; being a visual person, and having scanned through many charts over the last 20 years. Others who are numbers orientated may prefer one of the other tabs, such as ‘valuation’, ‘financial’, ‘performance’ etc, or you can even make your own custom view. Clicking on a stock ticker from the scan results takes us to a chart of the stock.
I have to say that the charts view is the fastest way of quickly scanning through the screener results. (This is assuming you are familiar with charting and know what you are looking for.)
Each page has 20 results (set your own levels in Finviz elite).

Finviz Elite Bubbles View
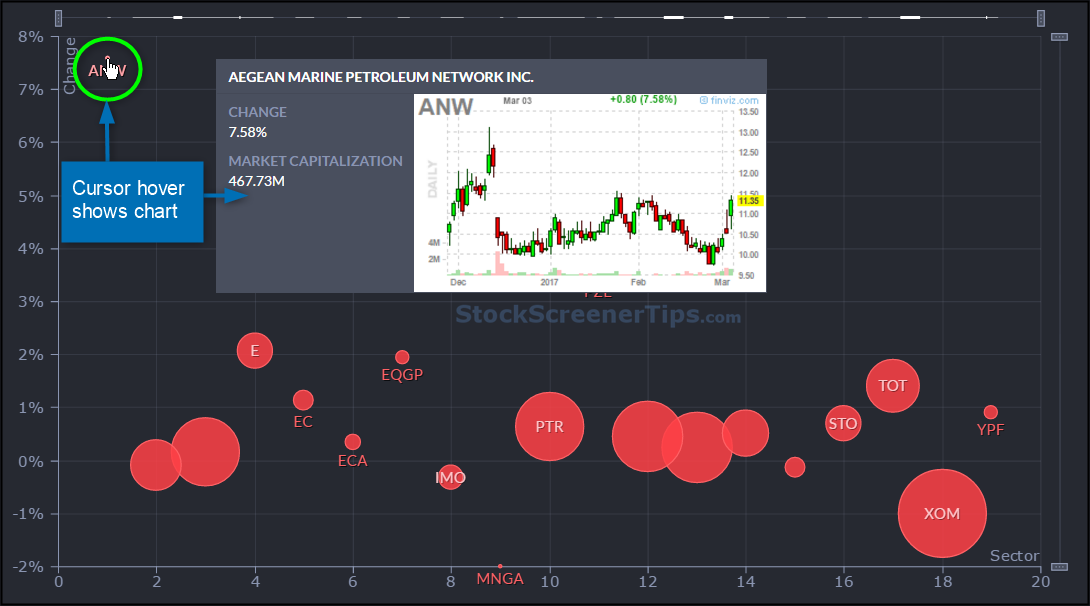
Another very useful view in Finviz elite is the Bubble view. Select the ‘Stats’ tab, and then select ‘Open in Bubbles’ to access this view.

The bubble view is an extremely useful visual tool to easily see the top performers of your scan.

As a visual person, I’m really impressed with this view. Hovering over the bubbles with your cursor shows a chart of that stock. A really great tool for helping you focus on the stocks that best meet your criteria.
Finviz Elite Export Data to Excel Option
The Elite version also allows the option to export the scan results data into excel. Handy for those who like to further interrogate the results via excel, or just for record keeping.

Finviz Elite Correlations
For Finviz Elite members, under the chart there is also a list of correlated and inverse correlated stocks and ETFs.

This is extremely useful for those that like to hedge, or go long and short at the same time. Hovering over a ticker will also show the chart.
Finviz Premarket Scanner
Many active traders rely on premarket movers for possible trades to focus on during the open. Premarket data is available for Finviz Elite users from 9AM EST before the market open. The red ‘PREMARKET’ sign indicates results shown are for the premarket.
Note: You get Finviz real time data with Finviz Elite membership.

As an example, we can investigate further, the top two results shown.(This is just for example purposes, not an indication of a trade.) Clicking the stock ticker will take us to the stock chart.


One of the great features of the Finviz screener is the aggregating of the news for a stock, under the chart. These news items should explain the reason for the premarket move. If the reasons seem fundamentally sound, and may have a lasting effect, the stock could be a possible trade.


Note: Please always do your own further research before putting your hard earned money on the line. Just because a stock shows up on a scan, doesn’t make it an automatic trade.
Finviz Alerts Review
Stock screening is the first step in reducing the workload in our search for winning stocks. Once we have our scan results, they are not necessarily an immediate trade. Most of the time the stocks go on our watchlist, and must then meet a setup criteria or price break, before a trade is finally triggered. This is where alerts come in. In my mind they are as important as screeners. Before screeners became easy to use, many traders performed manual scans, and then used price alerts to trigger the trade.
I know many traders who take the time to create a watchlist, but due to life’s stresses, forget to monitor them. Before they know it, many of the stocks on the watchlist have made big moves, without them on board. That’s one of the most frustrating things in the trading world.
That’s why I say Alerts can be as important as screeners. Alerts will save you as much time as screeners, because once set, you don’t need to look at that stock again, unless you want to. More importantly, alerts will ensure you don’t miss a trade you have been waiting patiently for.
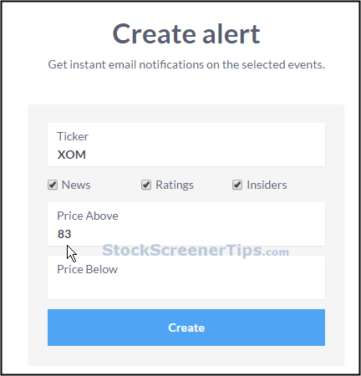
Finviz Elite allows email alerts to be created on price, news, and insider transactions. Alerts will really save you time, and money on open trades. I rely heavily on alerts.

Finviz Elite Performance Comparison Charts

Comparison charts can help us to see which stock in a sector is outperforming another stock and the market. If we want to beat the market, we need to find individual stocks that are outperforming the market.
In the example above, Chevron is not only outperforming Exxon, but also the Market (SPY). However, the Crude Oil chart (not shown) at the time was topping out and starting to rollover, indicating lower prices. The Chevron & Exxon charts were already in a short-term pullback.
Many traders are inclined to go for the cheaper stock. I prefer to buy strength. Either way, Comparison charts can clearly show us this information.
Finviz Backtesting Review
Before using your hard earned money on a new trading strategy, it is always a good idea to backtest it.
Finviz ‘Backtest’ has over 100 technical indicators available, and over 16 years of historical data. Results can also be compared against the SPY benchmark.
The backtesting software is easy to use. Just enter your entry/exit conditions and run the backtest. Note that you can have many entry/exit conditions.

Below is an example of the results returned for a very simple entry/exit strategy. Note:This is just an example, not a serious strategy.

The ‘STATISTICS’ and ‘RETURN TABLE’ show much more detailed information (not shown). In the simple example above the ‘max draw-down’ is not acceptable. The idea with backtesting is to add more rules to improve the results, without too much curve fitting.
Finviz Backtesting of Indicators
There has been much debate over whether technical indicators actually work. The truth is some indicators do work, but many are useless.
Finviz has actually performed a comprehensive backtest of many indicators with various settings, over a 15 year period on thousands of stocks.
The findings will surprise you, it certainly surprised me. Are you using an indicator that doesn’t work, or one of those that are shown to be profitable in the Finviz backtest? The findings are only available to Finviz Elite members. It’s certainly worth a look.
Summary
This Finviz Elite review shows how this stock screener can help you find trading opportunities every-day. Finviz Elite comes with real-time data, including Premarket.
The Bubbles view and heat map makes it easy to see the top performing stocks.
Being able to see the stock screener results in Charts View, really speeds up the process of evaluating the scans.
The Finviz news function, financial data, and links to statements, makes this ideal for Investors who want all their research in one place.
Add to this the backtesting function, and the ability to export data to excel, makes this a decent research tool.
| Finviz Elite Review Rating | |
|---|---|
| 🏆 Features | ★★★★★ |
| 📊 Screener | ★★★★✩ |
| 📈 Charts | ★★★★✩ |
| ✅ Ease of Use | ★★★★★ |
| 📧 Customer Service | ★★★★★ |
| ⭐ Rating | ★★★★★ 4.5/5 |
For more information about the Finviz Elite Stock Screener visit FINVIZ
You could also consider Stock Rover as an alternative. Read the full Stock Rover Review.


